|
Nikkor AF 24mm f/2.8D - Review / Test Report - Analysis |
|
Lens Reviews -
Nikon / Nikkor (APS-C)
|
|
Page 2 of 3
Distortion
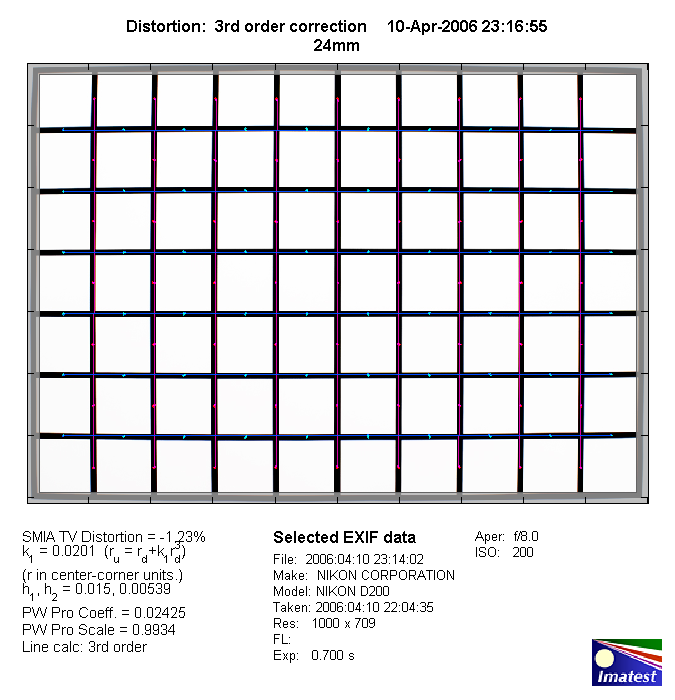
The AF 24mm f/2.8D exhibits slight barrel distortion (1.2%) which is usually
nothing to worry about.

The chart above has a real-world size of about 120x80cm.
Vignetting
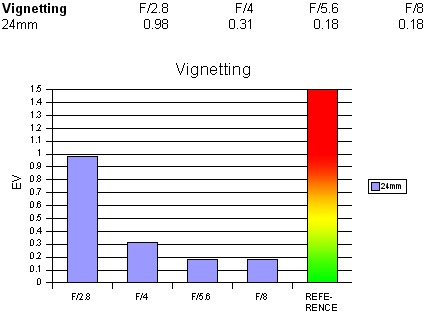
The AF 24mm f/2.8D is a full frame lens thus enjoying a sweet spot advantage
on APS-C DSLRs. Nonetheless it still produces very pronounced vignetting of
almost one full stop at wide-open aperture (f/2.8) - a little disappointing.
However, from f/4 and up the issue is not field-relevant anymore.

MTF (resolution)
The Nikkor showed a rather mixed performance in the lab. The sheer resolution
figures are generally very decent. The center performance is already very high
at wide-open aperture and it even reaches the resolution limits of the
D200 at f/5.6. The border quality is good at f/2.8 gradually improving
towards a peak around f/8 with very-good results.
A rather annoying characteristic of the lens are spherical aberrations (focus
shifts when stopping down). At focus distances below ~2-3m and medium aperture
settings you should visually confirm the depth-of-field (via DOF preview). This
is a fate shared by a couple of lenses of that design era. The lens also exhibits
a moderate degree of field curvature.
Please note that the MTF results are not directly comparable across the different systems!
Below is a simplified summary of the formal findings. The chart shows line widths per picture height (LW/PH) which can be taken as a measure for sharpness.
If you want to know more about the MTF50 figures you may check out the corresponding Imatest Explanations
Chromatic Aberrations (CAs)
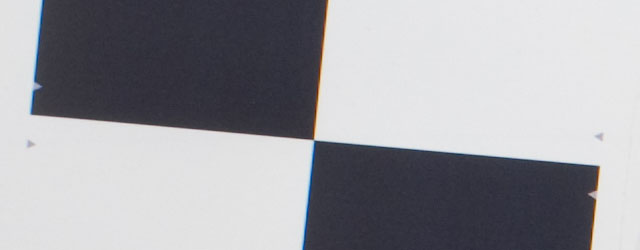
Chromatic aberrations (color shadows at harsh contrast transitions) are a weakness
of this lens peaking in almost 2 pixels on the average at the image borders at
medium aperture settings. Unless you correct the issue via an imaging application
CAs will be quite easily visible in critical scenes.

Here's an example of the problem (upper left border portion of a test chart):

|