|
MTF - Modulation Transfer Function |
|
Technology -
Technology
|
|
Note: The following text passages may be able to give you an
idea about MTF. However, the hard theory behind it is much bigger than what can be explained within an
article.
MTF = Modulation Transfer Function:
MTF-Tests are among the most accurate and scientific tests performed
on lenses. Here're some basic explanations by Olle Bjernulf:
"In a MTF test a pattern of lines, black and white, are projected with the
lens. The resulting contrast is measured. If the image has exactly the same
contrast as the test pattern, the value is 100%. This is a perfect lens which
is impossible. If the contrast is half, the value is 50%. A value of 0 (zero)
represents total loss of contrast, the line pairs are transformed to only
grey. Numbers over 80 (20 lp/mm) are excellent. Numbers under 30 are bad
even in small prints (10x15cm). The test is done in two directions, called
sagitally (or radially) and tangentially (or meridionally). That represents
lines from center towards edges and concentric circles. If they differ, the
lens suffers from astigmatism. At higher spatial frequencies, e.g. 30 vs
20 lp/mm, the MTF values are allways lower."
How to interpret MTF-data:
- Contrast/Brilliance: Readings at 5 (and maybe 10) lp/mm represent
the contrast-behaviour of a lens. Even small differences (2.5% !!!) can be
identified on the picture! You can think of it as a sort of basic "sharpness".
A good lens (stopped down) should perform over 95% at 5 lp/mm for both directions
(sagitally and tangentially). Values worse than 90% represent a bad performance!
A lens showing good contrast but low sharpness can indeed appear SHARPER
than a lens of low contrast and high sharpness! However, "sharp" lenses are
normally also "contrasty" lenses.
- Sharpness: Readings at 10 to 40 (or higher) lp/mm represent
the sharpness-ability of a lens. Readings taken at 40 lp/mm indicate how
good a lens can transmit very fine structures (e.g. hairs). Even bigger differences
(e.g. 10% at 40 lp/mm) cannot be identified directly on the picture! For an
optimal quality (based on the human eye and 35mm film) the lens should perform
over 50% at 20 lp/mm for a 13x18cm print!
For an optimal 30x40cm picture you would need over 63% at 70lp/mm!!! However
(almost) NO LENS IS ABLE TO PERFORM THAT WAY!!!
- Distortions, vignetting, flare and color balance are NOT visible
in an MTF
- Color fringing (lateral colors at the image borders) does
leave a distinctive clue in the MTF, but you need to examine a series of
MTF curves measured at different apertures to detect it. Color fringing
affects only the tangential curve, and it does not disappear as you stop
down. So, if the sagittal and tangential MTF curves become more widely
separated as you stop down, with sagittal getting better and tangential staying
more or less constant, then there is almost certainly color fringing present.
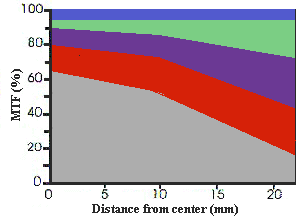
- Simplified rules for a good performance (2 f-stops down):
|
- the 40 lp/mm curves (red) should stay:
- >20% for the corner (right)
- >65% for the center (left).
- the 20 lp/mm curves (violett):
- >45% for the corner
- >80% for the center.
- the 10 lp/mm curves (green) should be very close to the 5 lp/mm curve
(blue).
- the 5 lp/mm curves (blue) should stay >95% for the whole X-axis.
|
You cannot expect to reach these values with all the different types of lenses.
E.g. extreme wide-angle lenses perform always worse towards the corner.
Very often the tangentially curve will be worse than the "channels" given
by the "rules". This may be compensated in part by higher values of the sagitally
curve.
Note:The performance values are usually much worse at extreme
apertures (wide-open or >f/16)! These values don't represent the max.
picture quality possible!!! The optimal point should be reached about 2-3
stops down - e.g. f/8 for a f/3.5 lens!
The following illustration may give you can idea about the importance
of a good contrast performance. It is also an attempt to show the relation
between image and MTF. Please note that the lines for sagitally and tangentially
curves are combined for these samples.
| Sharpness vs. Contrast: |
sample
image |

|

|

|

|

|
| corresponding simplified MTF at 10 (green) and 30 (red) lp/mm. |

|

|

|

|

|
|
perfect sharpness
& contrast |
not so sharp
but quite contrasty |
quite sharp but
not so contrasty |
bad sharpness
and contrast |
Total loss of
contrast |
Here're some real MTFs ...
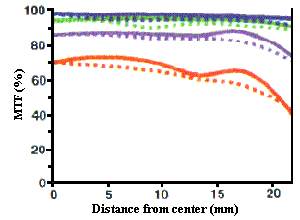
An outstanding performance - both in contrast and sharpness! |
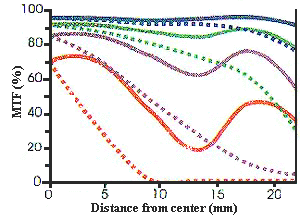
An example for a lens performing relatively good in contrast but showing
only a limited ability to transmit very fine structures ( tangentially at
40 lp/mm) |
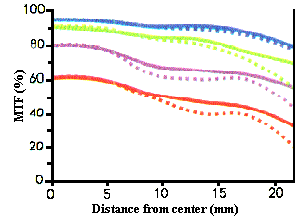
Good sharpness but quite bad contrast (5 lp/mm worse than 90%) |
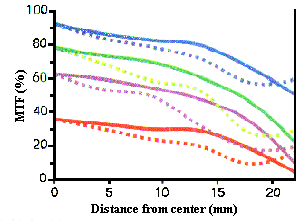
An example for a really bad performance - both in contrast and sharpness! |

|
|