|
Page 2 of 3

Distortion
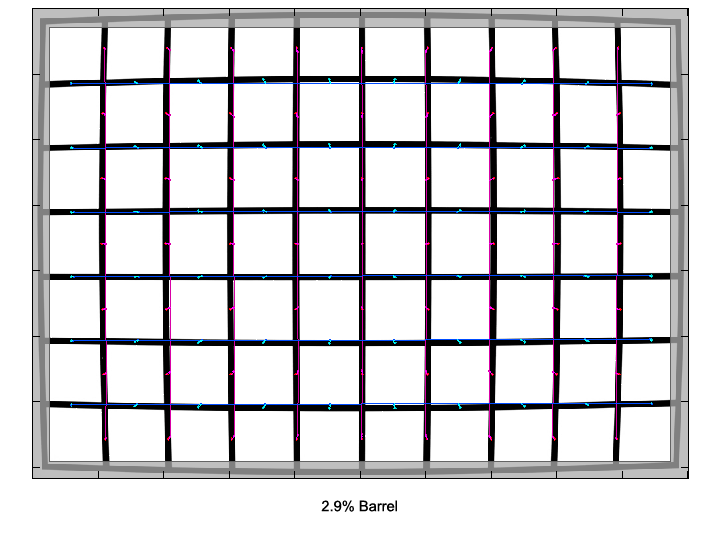
The Nikkor shows a distortion characteristic that's typical for super zooms. At the short end, there is significant barrel distortion, which very soon flips over to the pincushion type. It's already visible but still moderate at 18mm, increasing to significant amounts with longer focal lengths.
Both types of distortion are also illustrated by the railway shots at the end of the sample image section on the next page.
|
Move the mouse cursor over the focal length text marks below to observe the respective distortion
|
| 10mm |
18mm |
31mm |
48mm |
71mm |
100mm |
|

|
The chart above has a real-world size of about 120x80cm.
Vignetting
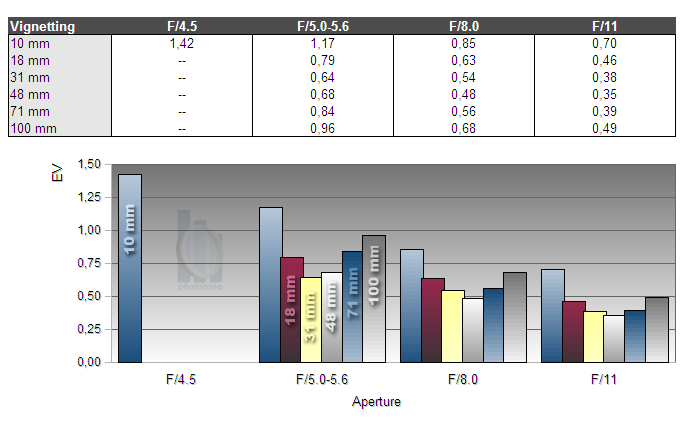
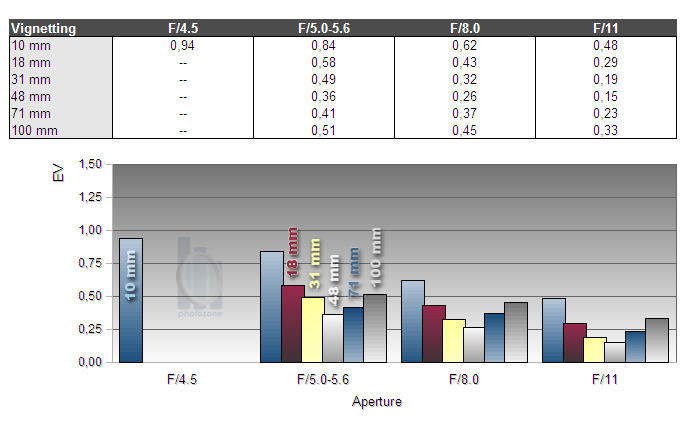
Even though the Nikkor is a quite large lens, especially in relation to the small sensor used in the Nikon 1 cameras, the amount of vignetting is rather high, especially at the wide end of the zoom range. The remaining focal lengths show a little pronounced light fall-off towards the corners wide open, but to a much lower degree. As usual stopping down helps to reduce the issue.
The chart below shows the vignetting characteristic based on NEFs converted by RAW Developer, which does not apply any correction.

Unlike distortion, Nikon chose to have vignetting corrected in the camera when shooting JPG (or using Nikon's View NX or Capture NX software to convert NEFs). The chart below shows the vignetting based on the same images as the previous chart, but automatically corrected by the camera firmware.

MTF (resolution)
The lens delivers excellent resolution in the image center throughout most of the zoom range, only at the long end center sharpness drops a bit. Please note that due to the small maximum aperture the lens is diffraction limited wide open already, so stopping down does not increase resolution any further (to the contrary, actually).
The borders and corners perform on a very good level, at least in the lower half of the zoom range. Towards the long end, the sharpness drops considerably here.
Please note that the MTF results are not directly comparable across the different systems!
Below is a simplified summary of the formal findings. The chart shows line widths
per picture height (LW/PH) which can be taken as a measure for sharpness.
If you want to know more about the MTF50 figures you may check out the corresponding
Imatest Explanations

Chromatic Aberrations (CAs)
The level of lateral CAs (color shadows at harsh contrast transitions) is quite high towards both ends of the zoom range, reaching peak values of around 2 pixels. In the medium part of the zoom range, CAs are better controlled and less of an issue.
However, CAs can easily be corrected in software, in fact the Nikon 1 cameras automatically do so if you shoot JPGs.

|